DATA INTERPRETATION (TABLES, BAR, PIE)
CSAT

WHAT IS DATA INTERPRETATION
Meaning
• Data Interpretation means analysing numerical data to draw conclusions
• Data is usually presented visually for comparison
Objective in CSAT
• Understand trends
• Compare values
• Calculate ratios, percentages, averages
• Eliminate wrong options logically
IMPORTANT SKILLS REQUIRED FOR DI
• Fast reading of data
• Approximation ability
• Percentage and ratio application
• Calm approach under time pressure
CSAT Insight
• DI is not about solving everything exactly
• It is about selecting the correct option smartly
TYPES OF DATA INTERPRETATION IN CSAT
Table-based Data
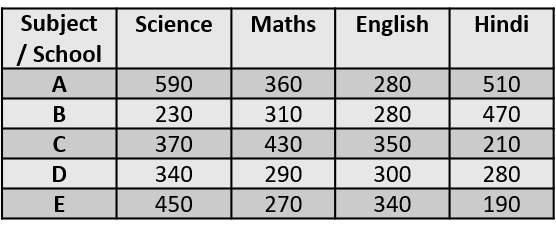
• Data given in rows and columns
• Most common DI type in OPSC
Key Points
• Read headings carefully
• Check units (thousand, lakh, percent)
• Compare row-wise and column-wise
Bar Graph

Meaning
• Data represented using bars of different heights
Types
• Simple bar graph
• Multiple bar graph
CSAT Tip
• Focus on relative height, not exact value initially
Line Graph
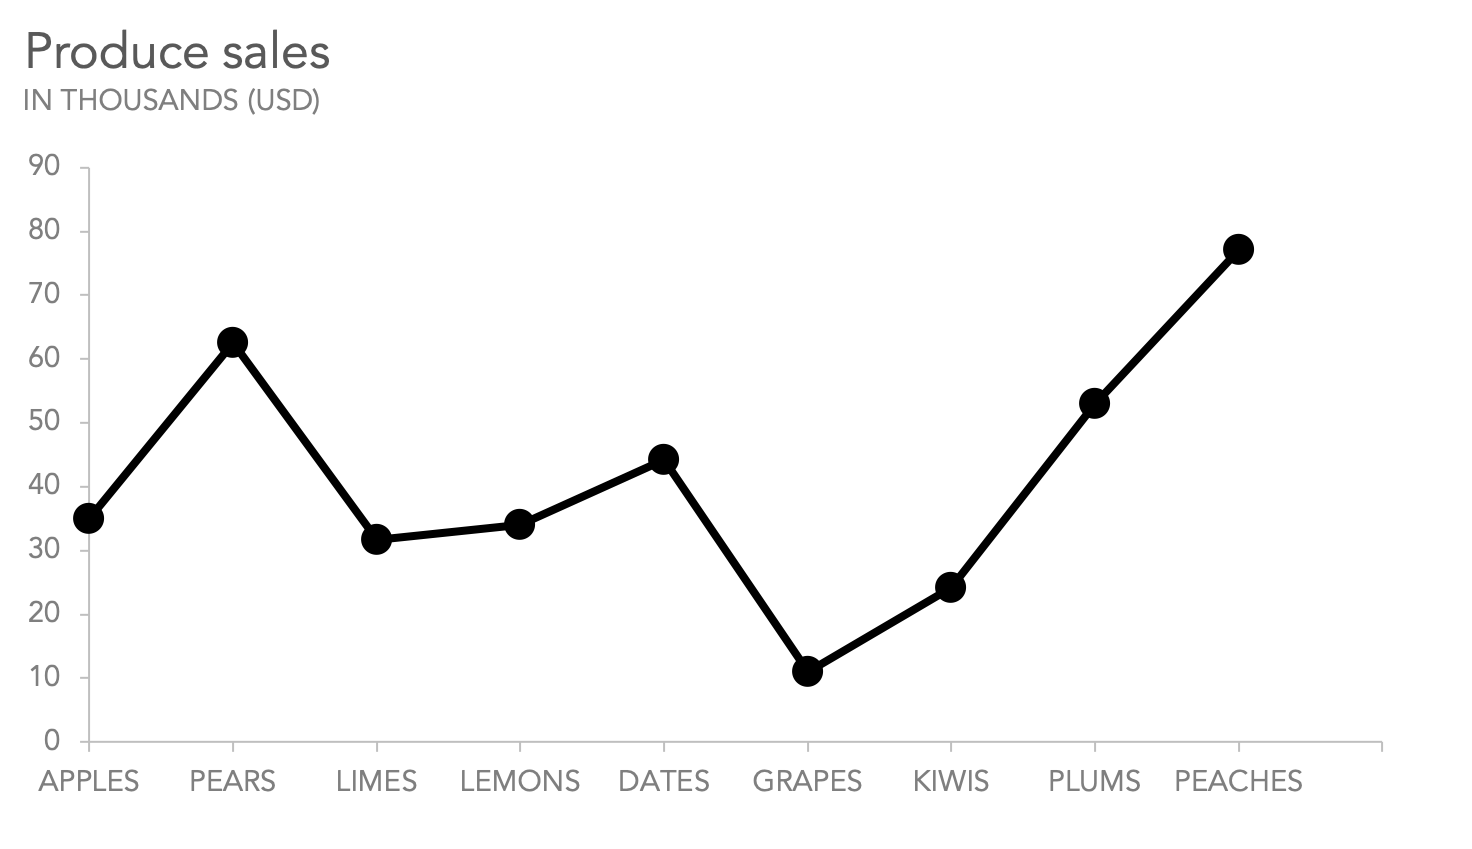
Meaning
• Shows trend over time
CSAT Use
• Growth or decline analysis
• Year-wise comparison
Pie Chart

Meaning
• Circular representation of data
• Total = 360 degrees
Key Concept
• Percentage = (Sector angle / 360) × 100
CSAT Tip
• Convert angles into fractions of 360
COMMON CALCULATIONS USED IN DI
• Percentage change
• Ratio comparison
• Average
• Difference between values
• Growth or decline rate
APPROXIMATION TECHNIQUE (VERY IMPORTANT)
Why Approximation
• Exact calculation wastes time
• Options are usually far apart
How to Approximate
• Round off numbers
• Use fraction equivalents
• Compare closest values
OPTION ELIMINATION STRATEGY
• Eliminate extreme options first
• Use rough estimation
• Avoid full calculation unless necessary
STEP-BY-STEP APPROACH TO SOLVE DI
Step 1
• Read the question first
Step 2
• Identify required data only
Step 3
• Approximate values
Step 4
• Eliminate wrong options
Step 5
• Final calculation if needed
PDF File:
No PDF attached
Subject: CSAT
← Back to Chapter